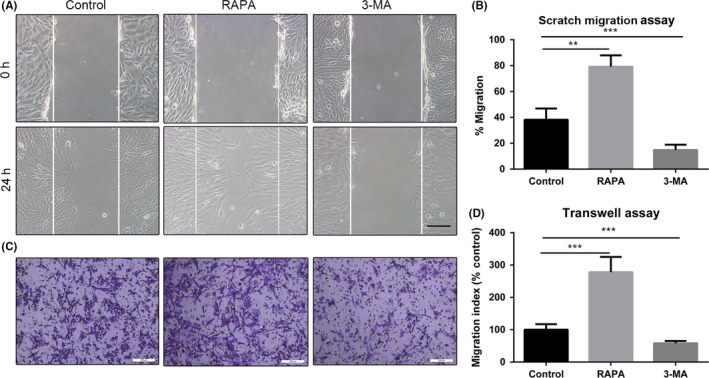
Figure 2.

Scratch migration and Transwell assays showing that a change in autophagy alters the migration of UC‐MSCs. A, Representative images of cell migration in a scratch migration assay (100×). B, Results of statistical analysis of the number of migrated cells are shown. Data are presented as the mean ± standard error of the mean. C, Representative images of cell migration in a Transwell system. Scale bar: 200 µm. D, Results of statistical analysis of the number of migrated cells are shown. Data are presented as the mean ± standard error of the mean. **P < 0.01 and ***P < 0.001 (both by one‐way analysis of variance). UC‐MSCs, umbilical cord‐derived mesenchymal stem cells
