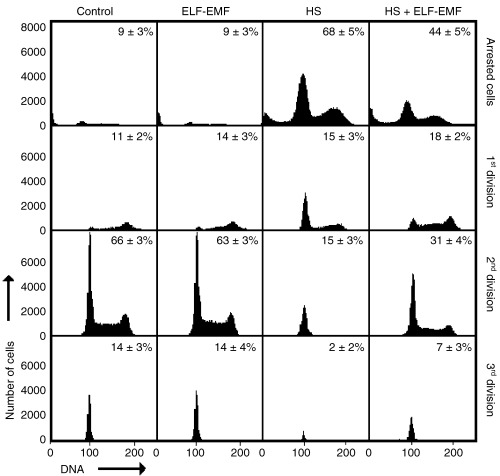
Figure 4.

Percentage of CFSE‐labelled cells in different cell generations 2 days after the HL‐60 cells were stressed as indicated in Figure 2. This graphical representation illustrates the different dynamics of cell division in the stressed and unstressed (control) cell cultures. The different cell generations (from no division to third division) were quantified by gating using the FlowMax software.
