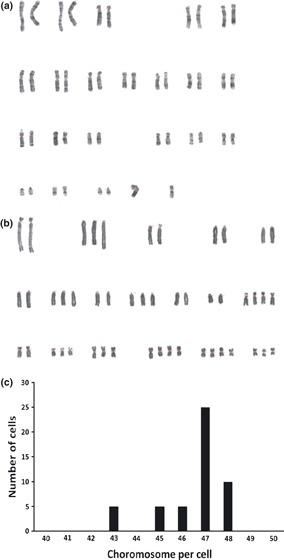
Figure 5.

Representative figure of cytogenetic studies on rabbitBM‐MSCs. Cells did not show profound chromosomal aneuploidy in Pi 20 (a), whereas all samples were aneuploid in Pi 80 (b). Graph c shows chromosome numbers per cell for 50 cells in Pi 80.
