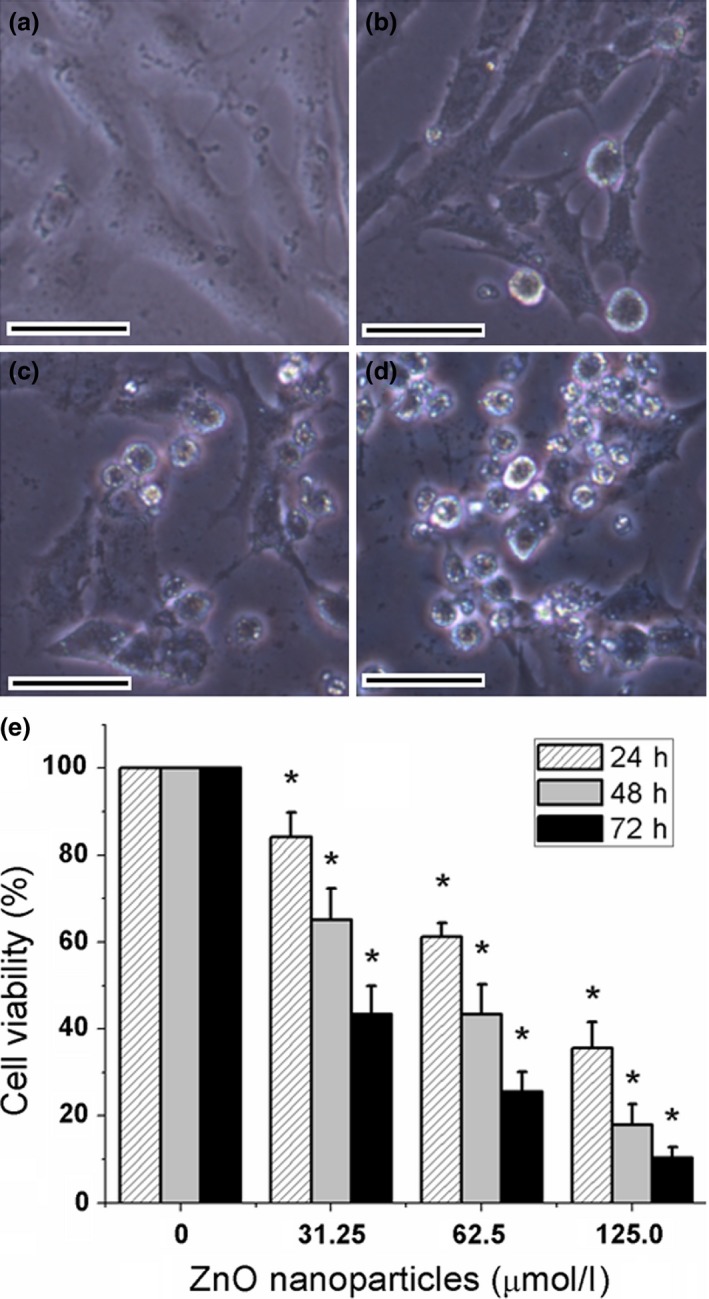
Figure 2.

Typical images of murine photoreceptor cells after treatment with different concentrations of ZnO NPs for 72 h (a–d) and cell viability determined by MTT assay for 24, 48 and 72 h (e). (a) Untreated cells; (b) cells treated with 31.25 μmol/l of ZnO NPs; (c) cells treated with 62. 5 μmol/l of ZnO NPs; (d) cells treated with 125.0 μmol/l of ZnO NPs. (e) Histogram analysis of cell viability determined by MTT assay. *P < 0.05 versus relevant control samples, NPs = nanoparticles and bar = 20 μm.
