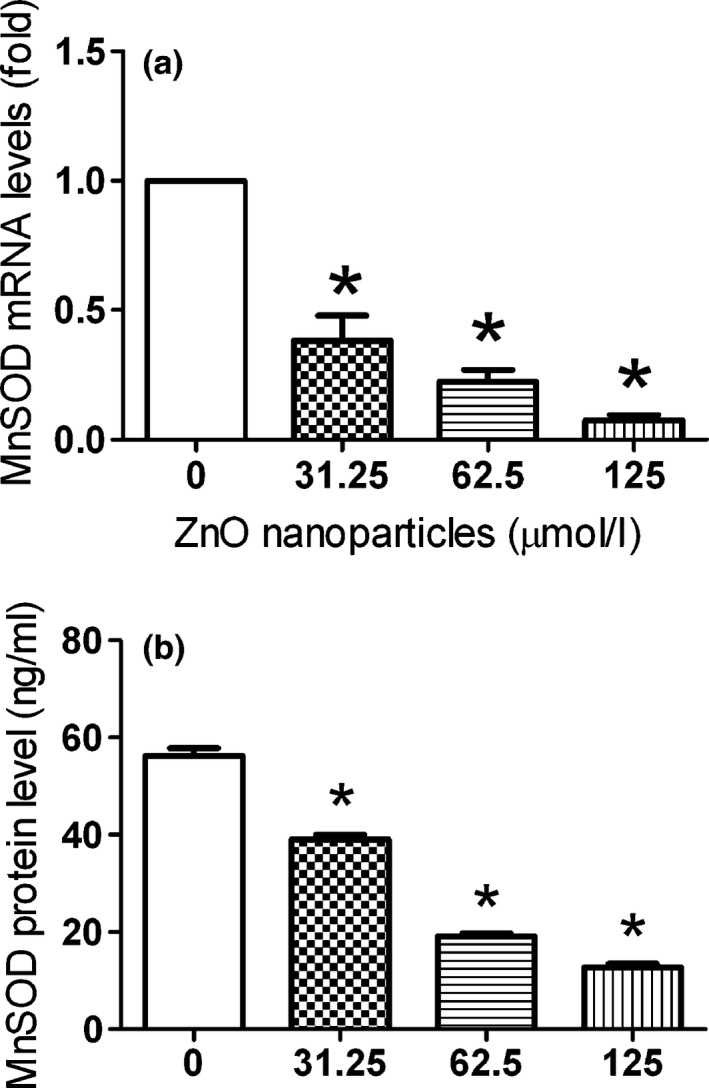
Figure 6.

The expression of Mn SOD at mRNA and protein levels during the ZnO nanoparticle treatment. Cells were seeded in six‐well plates and cultured overnight, then treated with different concentrations of ZnO nanoparticles either for 2 h (for mRNA measurement) or for 6 h (for protein measurement). Furthermore, alterations of MnSOD in both mRNA (a) and protein (b) levels were done using quantitative real‐time PCR and ELISA techniques respectively. Results were presented as mean ± SD (n = 3). *P < 0.05 versus control group.
