Figure 3.


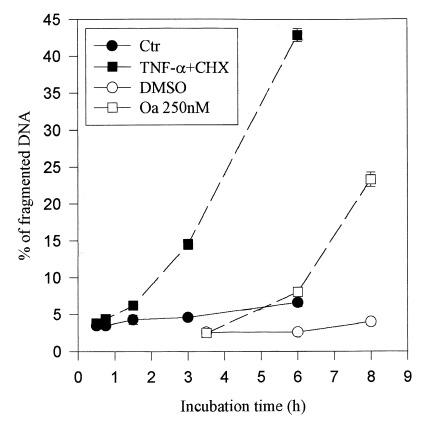
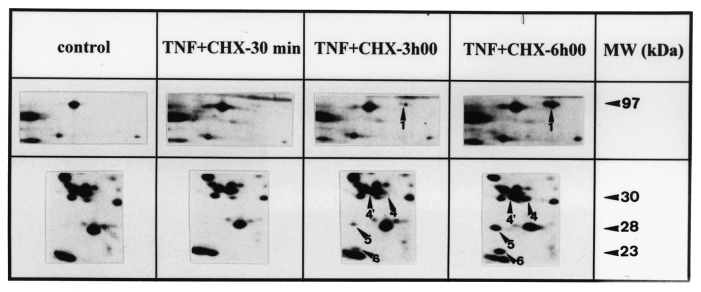
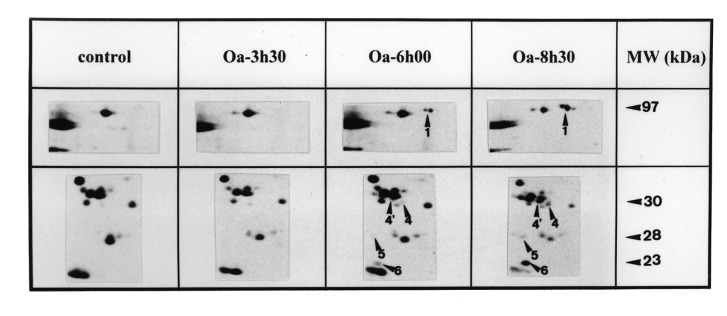
Kinetics of DNA fragmentation and protein modifications in BAE cells. (a) Kinetics of DNA fragmentation. BAE cells were seeded and 24 h later their DNA was prelabelled for 24h with [3H]thymidine (37 kBq/ml). After washing, they were incubated with specified agents for indicated times. At the end of incubation, cells were lysed and the percentage of DNA fragmentation was estimated as reported in Materials and methods. The data are mean of triplicate measurements ±sd of one representative experiment out of two. (b) and (c) Kinetics of protein modifications observed on 2D‐PAGE. The cells were seeded and 24h later, their proteins were prelabelled with [35S]methionine (3.7 MBq/ml). After washing, they were incubated or not with (b) TNF‐α (30ng/ml) + CHX (2µg/ml) or (c) okadaic acid (250nM) for specified times. They were then lysed and their proteins were submitted to 2D‐PAGE as described in Materials and methods. The 2D‐PAGE patterns of controls were obtained from extracts of cells directly harvested after the labelling period. The intensity of spots studied here did not significantly vary during the periods investigated in control conditions (data not shown).The figure reproduces limited regions of the 2D‐PAGE pattern. MW, molecular weight. Data shown are representative of two experiments.
