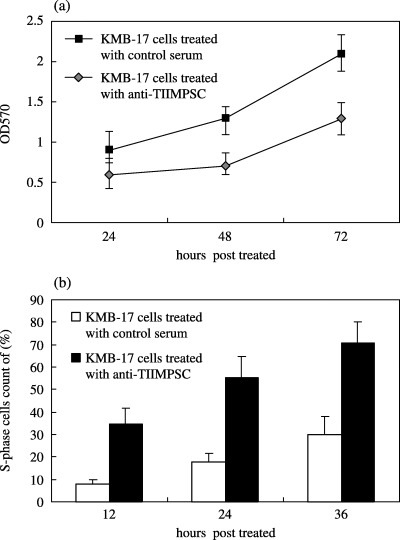
Figure 4.

Cell proliferation elevated by activation of TIIMPSC in IFN‐α treated or TIIMPSC‐transfected human embryo fibroblasts. (a) Cell proliferation analysis with the MTT assay in IFN‐α‐treated KMB‐17 cells. KMB‐17 cells pre‐stimulated with IFN‐α (100 µ/ml) were treated with specific antiserum to TIIMPSC, or with control serum, and were collected at 24, 48 and 72 h. Each experiment was performed in triplicate and results were analysed statistically. (b) Flow cytometric analysis of increase in the proportion of S‐phase cells after TIIMPSC activation in pcDNA‐TIIMPSC‐transfected KMB‐17 cells. The KMB‐17 cells treated with IFN‐α (100 µ/ml) followed by specific antiserum to TIIMPSC or control serum were collected at 12, 24 and 36 h post‐transfection. S‐phase cell sorting analysis was performed, based on DNA content. The mean percentage and standard deviation of triplicate samples were determined.
