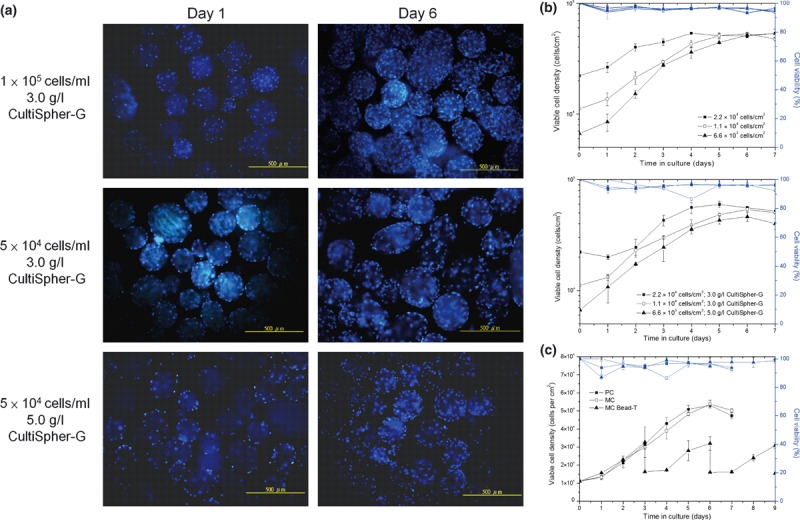
Figure 2.

Cell proliferation of BMMSCs grown in MC as compared to cells grown in PC by semi‐continuous method. (a) Proliferation of BMMSCs from MCs grown in semi‐continuous culture for 7 days at different initial cell densities (top, in cells/ml) and CultiSpher‐G concentrations (bottom, in g/l), then stained using Hoechst 33342 dye. Scale bar = 500 μm. (b) Growth kinetics of BMMSCs comparing PCs and MCs with different initial cell densities of 2.22 × 10⁴, 1.11 × 10⁴ and 6.7 × 10³ cells/cm2 (n = 3). Data presented in semi‐log linear charts by Double‐Y plot that includes viable cell density (block lines) and cell viability (blue lines). (c) Viable cell density of BMMSCs in MC bead‐T as compared to cells grown in PC and MC at initial cell density of 1.11 × 10⁴ cells/cm2. Data displayed in linear chart by Double‐Y plot that includes viable cell density (block lines) and cell viability (blue lines).
