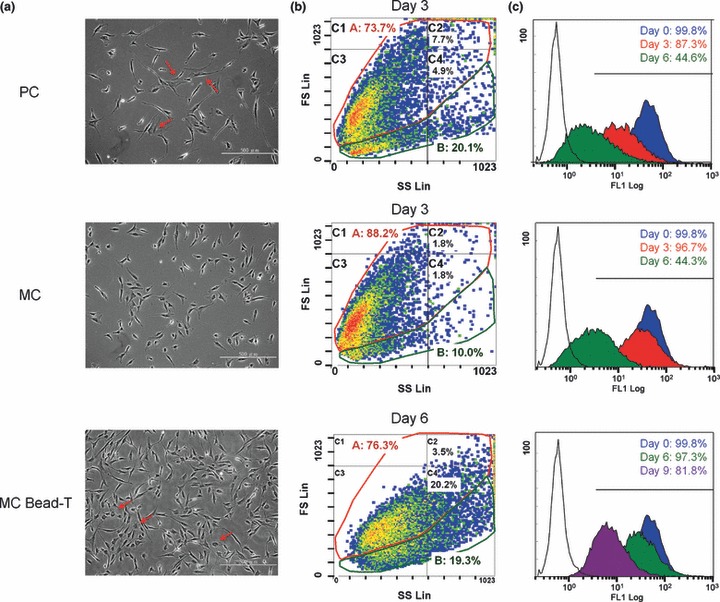
Figure 3.

Effects of different cell culture methods on morphology and surface marker density of BMMSCs. (a) Photomicrographs of BMMSCs recovered from PCs and MCs at day 3 and from MCs bead‐T at day 6 and replated on to 35‐mm dishes for one day (red arrows, non‐spindle‐shaped cells). (b) Change in cell size and cell population of BMMSCs grown under the different culture conditions analysed by flow cytometry using forward scatter (FS) versus side scatter (SS) density plots. The density plots were divided into A division (red ring) and B division (green ring) based on two populations of BMMSCs present in PCs at day 3 or into C1–C4 divisions based on major populations of BMMSCs in MCs at day 3. Density level threshold, 50 cells, and density levels of 1–5 indicated by colour (blue to red). (c) Variation of surface marker density (CXCR4) of BMMSCs from different culture protocols shown in histogram plots derived from flow cytometry at days 0 (blue), 3 (red), 6 (green) and 9 (purple). Black‐line histogram indicates background signal; coloured histograms represent positive reactivity with the CXCR4 antibody.
