
Figure 4.
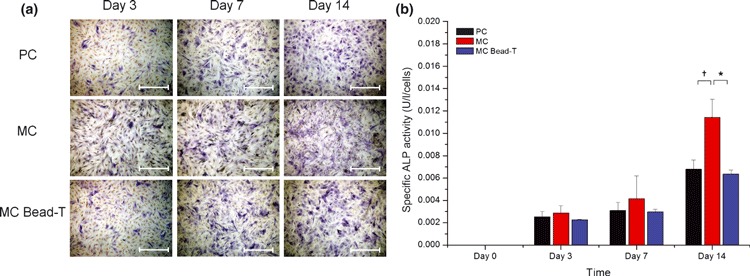
Osteogenic differentiation potential of BMMSCs recovered from PC, MC and MC bead‐T. (a) Photomicrographs of ALP activity of BMMSCs grown under different culture conditions as shown by ALP staining. Scale bar = 500 μm. (b) Quantification of specific ALP activity shown by spectrophotometry (O.D. = 405 nm). Results represented as mean ± SD of triplicate cultures from one representative experiment. *P < 0.05; †P < 0.01.