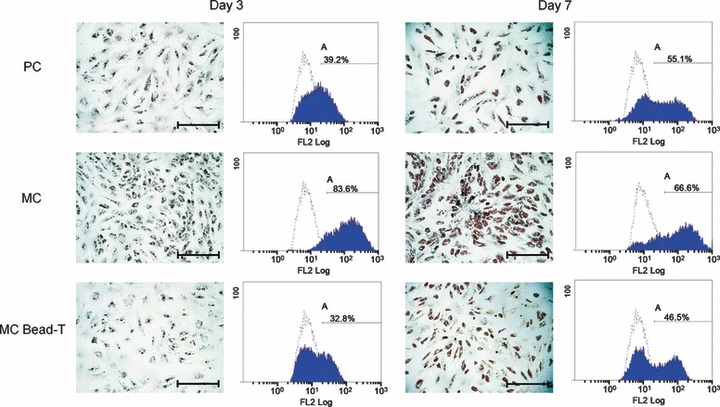
Figure 5.

Adipogenic differentiation potential of BMMSCs recovered from PC, MC and MC bead‐T. Photomicrographs of lipid spheres in BMMSCs grown in the different culture conditions as shown by Oil red O staining. Scale bar = 500 μm. Quantification of adipo‐differentiated BMMSCs (A division) in the different culture types, expressed as percentage of total cells, as derived from Nile Red flow cytometry. Open histogram indicates background signal (undifferentiated BMMSCs stained by Nile Red); blue histogram indicates staining for Nile Red.
