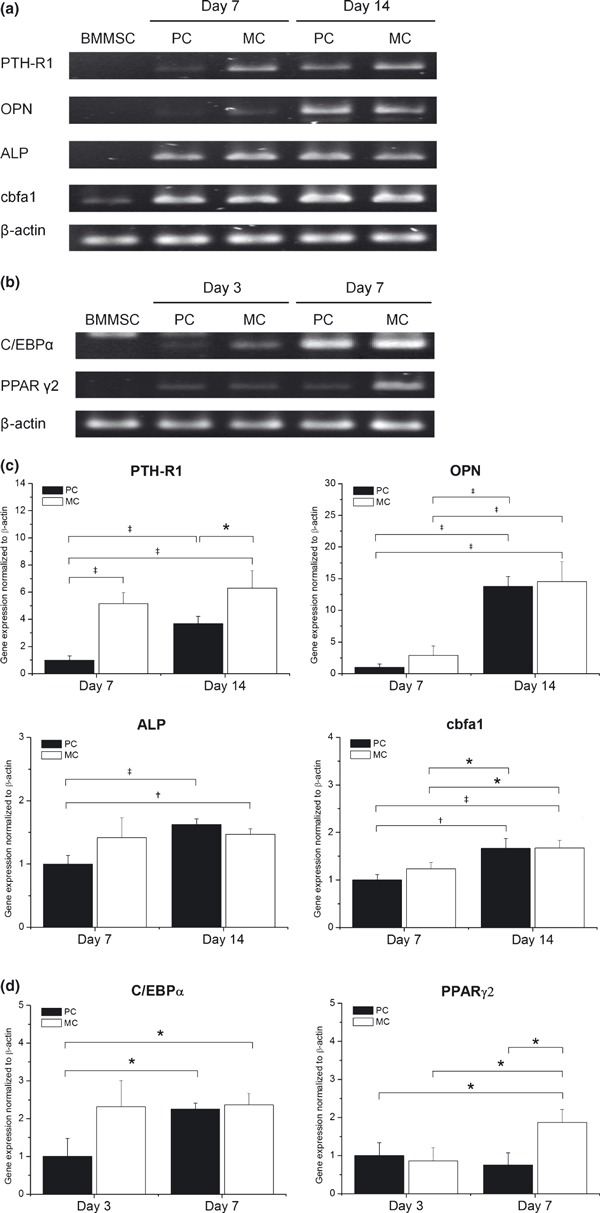
Figure 6.

Effect of MC on osteogenic and adipogenic gene expression in BMMSCs. Electrophoresis of reverse transcriptase‐polymerase chain reaction (RT‐PCR) products of (a) osteo‐differentiated and (b) adipo‐differentiated BMMSCs. BMMSC lane indicates undifferentiated BMMSCs from PC (day 3). To examine changes in expression of (c) osteogenic and (d) adipogenic genes with time respectively, cells were harvested on indicated days and subjected to semi‐quantitative RT‐PCR followed by agarose gel electrophoresis and ethidium bromide staining. β‐actin was amplified as internal control. RT‐PCR amplification products quantified and values represent fold change relative to day 7 of PC (osteogenesis) or day 3 of PC (adipogenesis). Data points represent mean value ± SD (n = 3). *P < 0.05. †P < 0.01. ‡P < 0.005.
