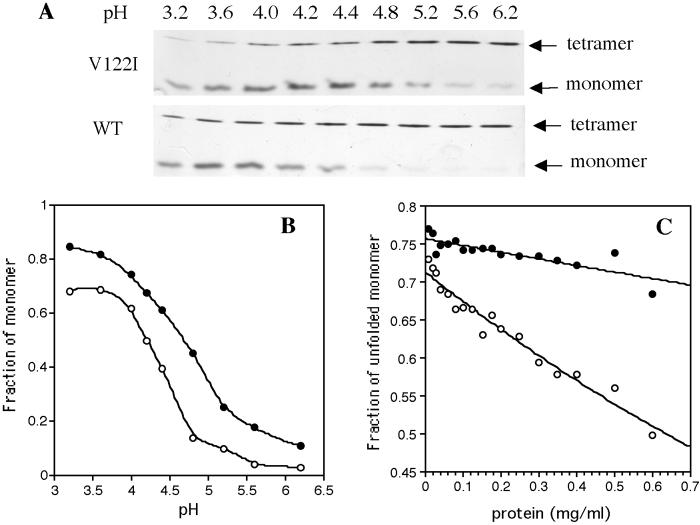
Figure 3.
(A) SDS/PAGE analysis of TTR quaternary structure as a function of pH. (Upper) V122I TTR; (Lower) WT TTR. (B) Mol fraction of monomer as a function of pH calculated by using densitometry from the gels shown in A. A smoothing curve applied to the V122I (●) and WT (○) data guides the eye. (C) Tetramer stability as a function of TTR concentration for V122I (●) and WT (○) in 4 M urea. Samples were incubated for 96 h at 25°C before analysis.

