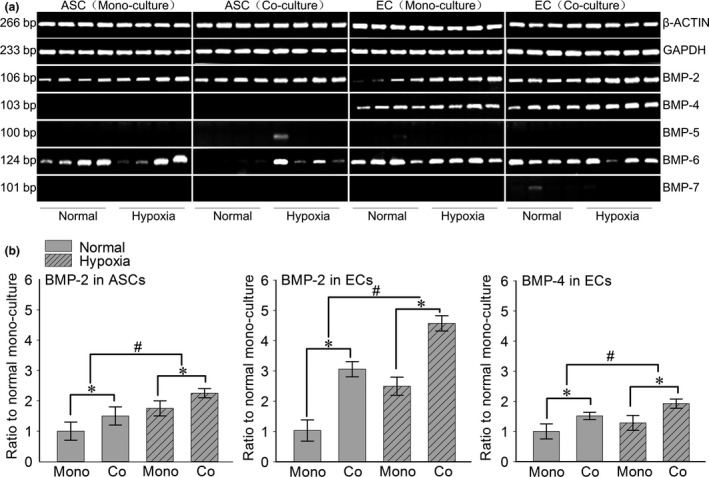
Figure 4.

Hypoxia induced the different gene expressions of BMPs in both ASC s and EC s in co‐culture system. (a) Semi‐quantitative PCR showed increased gene expressions of BMP‐2 in both ASCs and ECs, while BMP‐4 was increased only in ECs. Housekeeping genes (GAPDH and β‐ACTIN) were set as the inner controls. The samples were taken at 7 days. Four lanes in each group represent the four repeats in an individual experiment. The gels shown were representative of three experiments (n = 3). (b) The fold changes were calculated by OD method with Quantity One 4.6.3 software (bio‐Rad) based on the semi‐quantitative PCR (Fold changes represented the mean average ratio of the other three groups to the normal mono‐culture group). #Significant difference with respect to the normal mono‐culture group control (P < 0.05).
