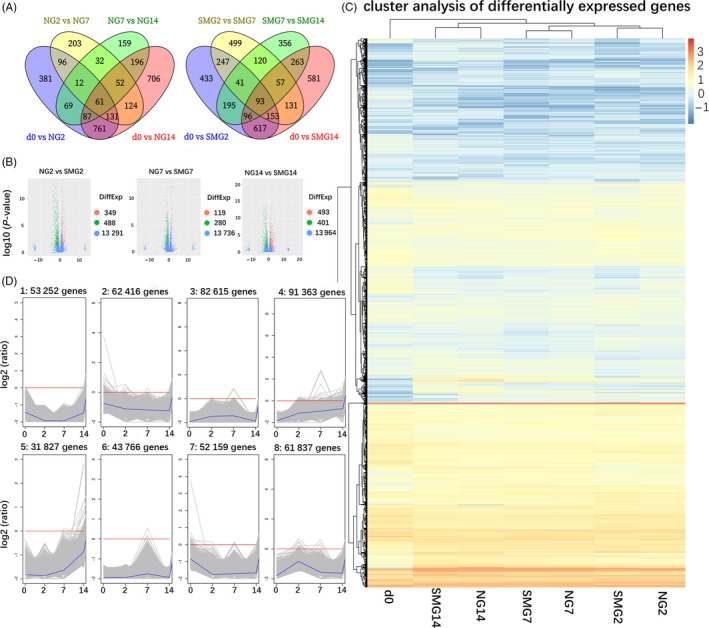
Figure 1.

DEGs of days 2, 7 and 14 and clustering of DEGs. (A) Venn diagram of DEGs comparing d0 vs NG2, NG2 vs NG7, NG7 vs NG14, and d0 vs NG14 and Venn diagram of DEGs comparing d0 vs SMG2, SMG2 vs SMG7, SMG7 vs SMG14 and d0 vs SMG14. (B) DEGs of NG2 vs SMG2, NG7 vs SMG7 and NG14 vs SMG14. The red, green and blue dots represent up‐regulated, down‐regulated and not significant genes, respectively. (C) The heatmap shows the K‐means clustering of transformed expression values for mRNAs. Yellow represents higher expression, and blue represents lower expression. (D) The line charts represent the expression patterns of genes in the NG and SMG group in eight clusters corresponding to the heatmap. The first four clusters are in the NG group, and the last four clusters are in the SMG group. DEGs, differentially expressed genes; NG, normal ground condition; SMG, simulated microgravity; d0, cells induced for 0 d; NG2, cells induced for 2 d under normal ground condition; SMG2, cells induced for 2 d under simulated microgravity; NG7, cells induced for 7 d under normal ground condition; SMG7, cells induced for 7 d under simulated microgravity; NG14, cells induced for 14 d under normal ground condition; SMG14, cells induced for 14 d under simulated microgravity
