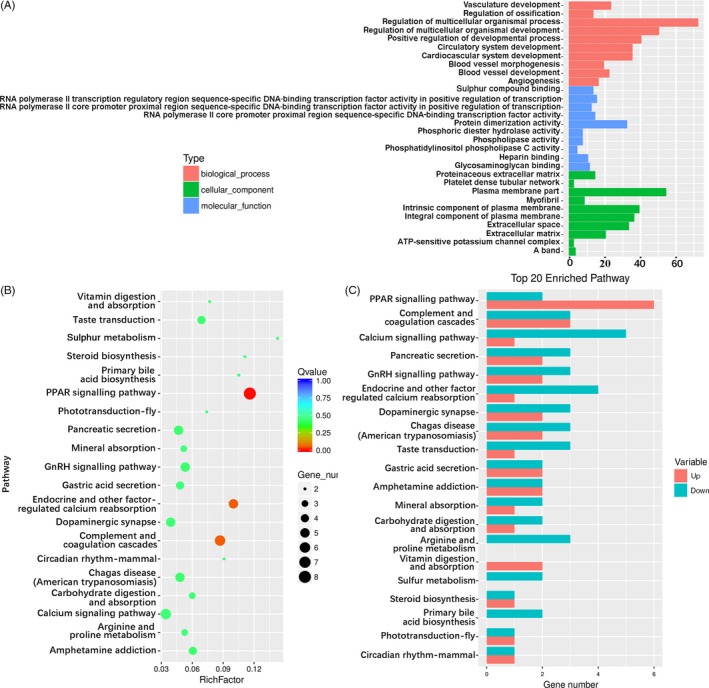
Figure 4.

GO and pathway analysis of DEGs in NG7 vs SMG7 samples. (A) GO analysis of DEGs in three ontologies. Red, blue and green represent biological process, cellular component and molecular function, respectively. (B) Top 20 statistics of pathway enrichment for NG7 vs SMG7. The size of dot represents the number of DEGs. A large enrichment factor denotes a high degree of enrichment. The lower the q‐value, the more significant the enrichment of DEGs. (C) Up‐ and down‐regulated genes of top 20 enrichment pathways. Red represents up‐regulated genes, and green represents down‐regulated genes. GO, gene ontology; DEGs, differentially expressed genes; NG7, cells induced for 7 d under normal ground condition; SMG7, cells induced for 7 d under simulated microgravity
