
Figure 2.
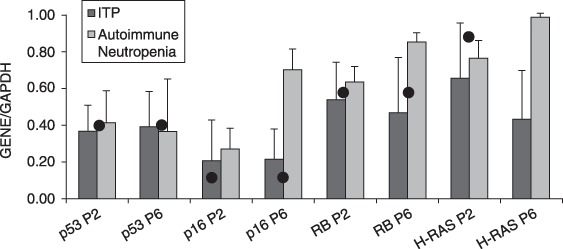
mRNA expression of p53, p16, RB, H‐RAS relative to GAPDH in mesenchymal stromal cells (MSC) according to disease group. Bar graphs represent mean expression levels of three independent experiments with SD (error bars). The expression levels of the same genes in HUVEC cells are denoted with a dot.