Figure 2.

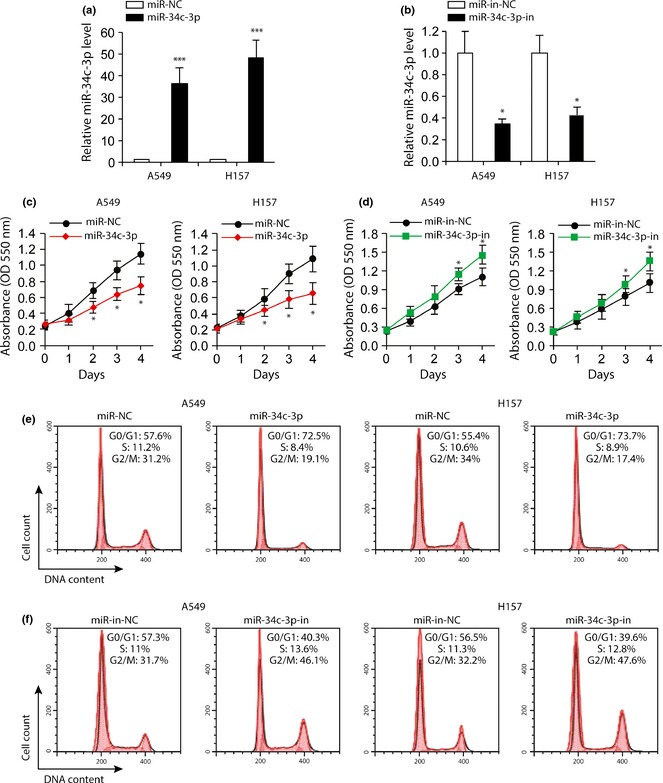
Effects of miR‐34c‐3p and miR‐34c‐3p‐in on NSCLC cell proliferation. (a) miR‐NC (negative control) or miR‐34c‐3p was transfected into A549 and H157 cells. Relative expression of miR‐34c‐3p was accessed by RT‐PCR after 48 h of transfection. n = 3. (b) Relative miR‐34c‐3p levels in A549 and H157 cells following 48 h transfection with miR‐in‐NC or miR‐34c‐3p‐in. (c and d) MTT cell viability assay of A549 and H157 cells transfected with miR‐NC or miR‐34c‐3p (c), miR‐in‐NC or anti‐miR‐34c‐3p (d) at indicated time points. n = 5. (e and f) Cell cycle analysis of A549 and H157 cells transfected with miR‐NC or miR‐34c‐3p (e), miR‐in‐NC or miR‐34c‐3p‐in (f) 2 days after transfection. n = 4. *P < 0.05, ***P < 0.001 compared to miR‐NC‐ or miR‐in‐NC‐transfected cells.
