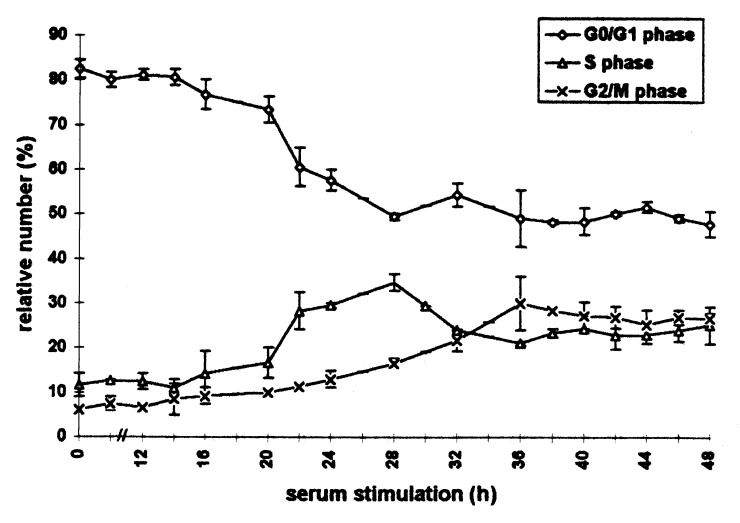
Figure 3.

Cell cycle distribution of heat‐shocked C6 cells after serum stimulation analysed by flow cytometry for 48 h. Rat C6 glioma scells synchronized by serum deprivation were heat‐shocked (44 °C, 30 min) directly after serum stimulation and harvested at the indicated times. After flow cytometric measurement, quantitative analysis of DNA‐histograms was performed using the Lysis II and Cellfit research programs (Becton Dickinson, San Jose, California). The proportion of cells in different phases of the cell cycle is plotted against the time of serum stimulation. (○): G1 phase (△): S phase (×): G2/M phase. Values are means (±SE) of three independent experiments.
