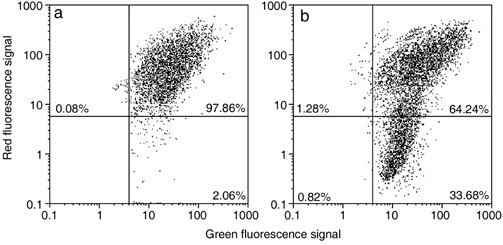
Figure 6.

Cytometric analysis of green‐versus‐red fluorescence of JC‐1 showing effects of cisPt treatment (b) on mitochondrial potential: compared to control (a), there is an increase of cell fraction with high green fluorescence and a relatively low red fluorescence.
