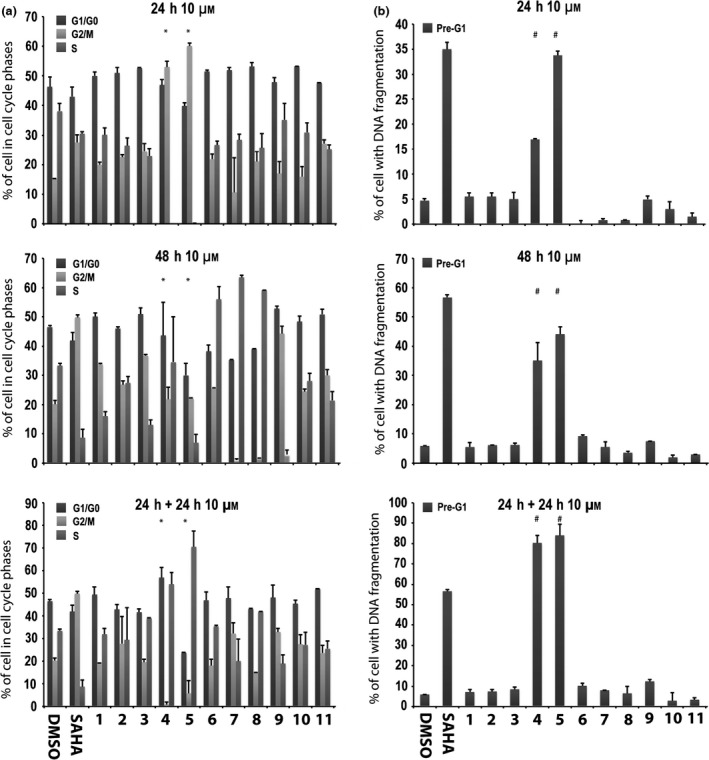
Figure 2.

Preliminary screening in MCF‐7 cells. Cell cycle analysis (a) and pre‐G1 phase (b) in MCF‐7 cells untreated (DMSO, negative control), treated with SAHA (positive control) at 5 μm and with compounds 1–11 at 10 μm for 24, 48 and 24 + 24 h. All data expressed as means ± standard deviation (SD) of three independent experiments. Statistical significance P‐value: 0.001 with the exception of * and # marked as 0.05.
