
Figure 6.
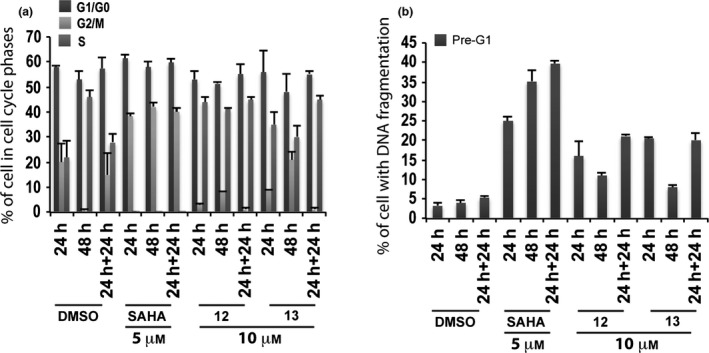
Biological evaluation in MePR2B cells for compounds 12 and 13. Cell cycle analysis (a) and pre‐G1 fraction (b) in MePR2B cells untreated (DMSO, negative control), treated with SAHA (positive control) at 5 μm and with compounds 12 and 13 at 10 μm for 24, 48 and 24 + 24 h. All data are expressed as means ± standard deviation (SD) of three independent experiments. Statistical significance P‐value: 0.001.