
Figure 4.
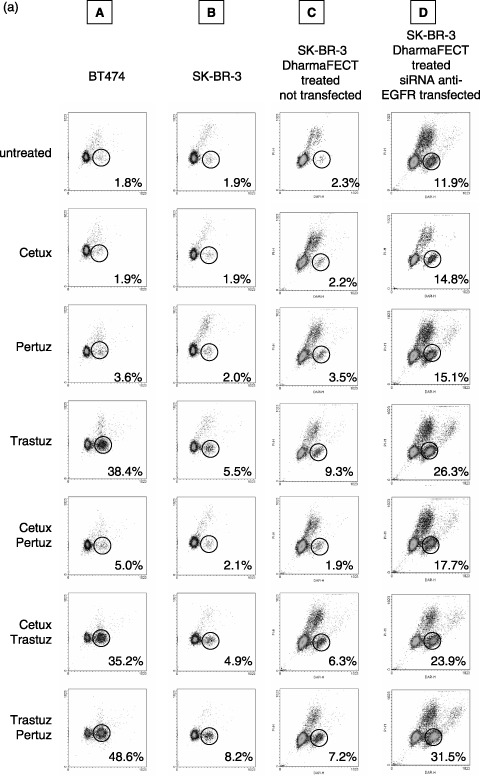
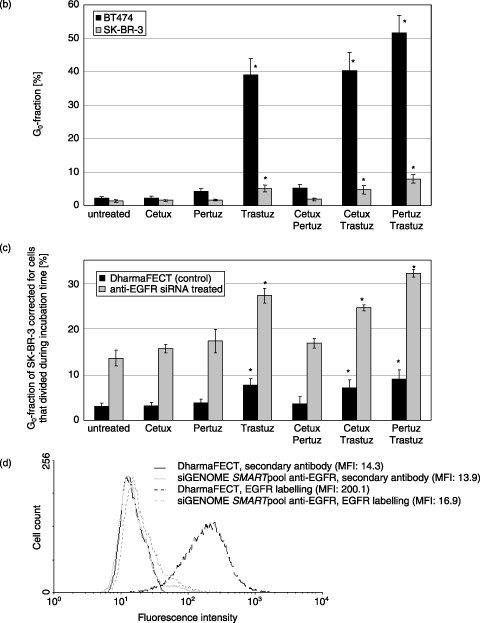
(a) Quantification of quiescent BT474 and SK‐BR‐3 cells without (columns A, B, C) and after (column D) siRNA mediated EGFR knockdown (column C = control). Cells were treated for 96 h with Cetuximab, Trastuzumab and Pertuzumab, applied separately or in pairwise combinations as indicated. Dot plots representative for a single experiment are shown. Without antibody treatment only 1.8% of BT474 and 1.9% of SK‐BR‐3 cells were found without BrdU incorporation within 90 h. The fraction of quiescent cells is strongly elevated in BT474 after Trastuzumab treatment (38.4%) and this effect is further enhanced if cells are treated with Trastuzumab and Pertuzumab simultaneously (48.6%). The fraction of quiescent SK‐BR‐3 cells is 5.5% and 8.2% induced by Trastuzumab treatment alone or in combination with Pertuzumab, respectively. Overall, Cetuximab does not increase the fraction of dormant cells; only a minor effect is seen in BT474 cells when Cetuximab is applied in combination with Pertuzumab (5% quiescent cells). The effect of antibody treatment in SK‐BR‐3 cells was evaluated after EGFR knockdown (column D). Cells treated with DharmaFECT without siRNA served as control (column C). The basal level of dormant cells in siRNA treated SK‐BR‐3 cells is higher (11.9%) than in untreated cells (1.9%), probably due to the lower EGFR content. Overall, the sensitivity to each antibody used in this study is increased after EGFR knockdown compared to normal SK‐BR‐3 cells. The most pronounced effect is observed in Trastuzumab/Pertuzumab treated cells showing 31.5% quiescent cells compared to 7.2% in the control sample. Data overview is given in Fig. 4b and 4c. Efficiency of EGFR knockdown in SK‐BR‐3 cells is demonstrated in Fig. 4d. (b) Quantification of quiescent G0‐cells in BT474 and SK‐BR‐3 cell lines after antibody treatment. Cells were treated for 96 h with Cetuximab, Trastuzumab and Pertuzumab separately or in pairwise combinations. The values for G0 cell fractions were corrected for the cell number that has divided during the BrdU labelling period as described in Materials and Methods. The data represent mean values of three independent experiments. Error bars indicate the standard deviation of the mean. * indicates statistical significance (P < 0.05) related to control. (c) G0‐fraction of SK‐BR‐3 cells without and after siGENOME SMARTpool anti‐EGFR siRNA treatment. The G0 fraction is presented in absolute numbers and corrected for the number of cells that have divided during incubation time as described in Materials and Methods. Overall, SK‐BR‐3 cells are sensitized to antibody treatment by EGFR knockdown. All treatment modalities are more effective after EGFR knockdown, represented by a larger cell fraction that is driven into quiescence by antibody treatment. The most significant effect is evident after Trastuzumab treatment (alone or in combination): The G0‐fraction after siRNA transfection is increased from 7.8% to 27.3% (by Trastuzumab treatment), from 7.2% to 24.8% (by Trastuzumab, Cetuximab treatment) and from 9.3% to 32.4% (by Trastuzumab, Pertuzumab treatment). Three independent experiments were performed. Error bars indicate the standard deviation of the mean. * indicates statistical significance (P < 0.05) related to the control. (d) EGFR knockdown in SK‐BR‐3 cells by siGENOME SMARTpool anti‐EGFR siRNA 3 days after first transfection. Mean fluorescent intensity (MFI) of EGFR staining in non‐transfected cells is 200.1 compared to DharmaFECT treated control (14.3). 96% of EGFR was homogeneously knocked down in the SK‐BR‐3 cell population by siGENOME SMARTpool anti‐EGFR transfection (MFI 16.9).