
Figure 2.
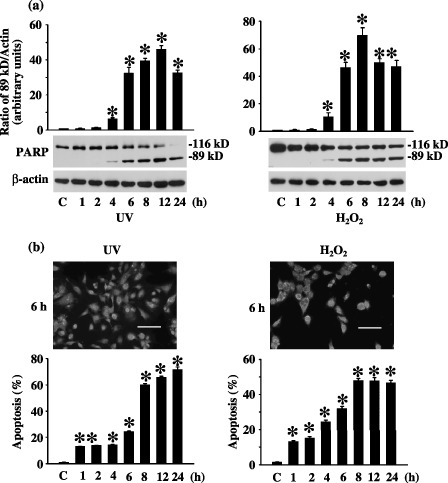
Cell death induced by ultraviolet (UV) or H2O2. (a) Stress‐induced caspase 3 activation. Cleavage of PARP was used as one measure of cell death and was performed by immunoblot of total poly(ADP‐ribose)polymerase (PARP) (116 kD) and the large cleavage fragment (89 kD) after cells were treated with UV or H2O2. Quantification of the densitometric ratio of the 89 kD PARP fragment and β‐actin is presented, as well as the representative Western blotting results. C is untreated control sample. β‐Actin is the loading control. (b) Stress‐induced nuclear condensation. Percentage of mouse embryonic fibroblast (MEF) apoptosis after UV or H2O2 treatment was measured by acridine orange (AO)/ethidium bromide (EB) nuclear staining. Cells stained in orange (apoptotic cells) and green (living cells) were scored under a fluorescence microscope. To the top are representatives of the photographs. To the bottom is the quantification. The scale bar is 100 µm. C is untreated control samples. * statistically different (P < 0.05, n = 3) compared to controls.