
Figure 3.
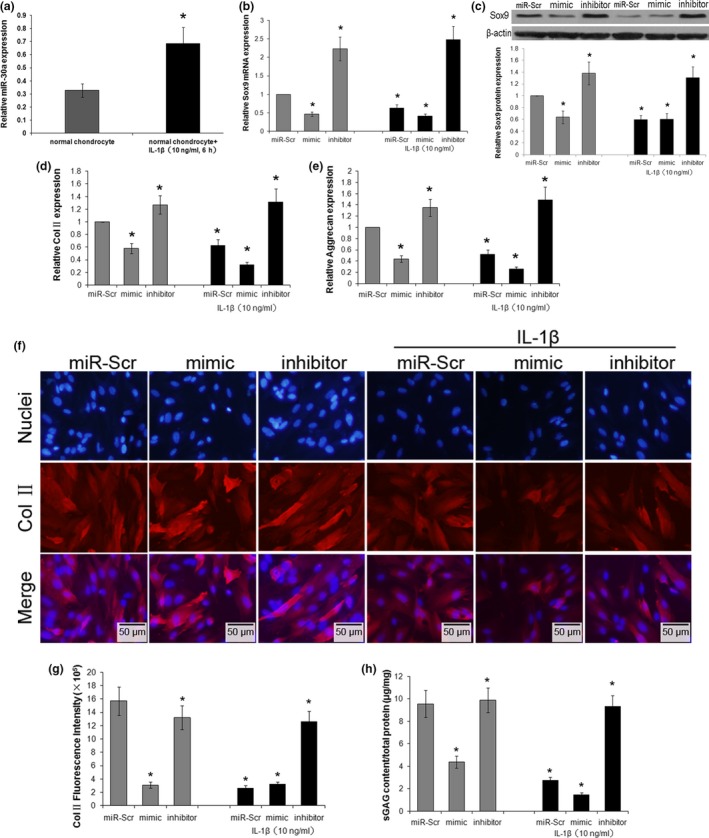
Effects of miR‐30a on IL‐1β‐induced ECM degradation. Chondrocytes were transfected with miR‐Scr, miR‐30a mimic (mimic), or miR‐30a inhibitor (inhibitor), and then treated with or without 10 ng/ml IL‐1β for 6 h. (a) The expression of miR‐30a in normal chondrocytes with or without IL‐1β treatment was analyzed by real‐time PCR. Data were normalized to U6. The expression of Sox9 mRNA (b) and protein (c) were analyzed by real‐time PCR and western blotting, The analysis was performed using images of three independent experiments, respectively. Data were normalized to β‐actin. The mRNA levels of Col II (d) and proteoglycan aggrecan (e) were evaluated by real‐time PCR. Data were normalized to β‐actin. (f) The Col II expression in transfected chondrocytes was assessed by immunofluorescence staining. Scale bars: 50 μm. (g) The fluorescence intensity of Col II expression was analyzed using Image‐Pro Plus 6.0 software. Data were expressed as the average of at least five images. (h) sGAG content in the cell suspension was assessed by DMMB method. Data were normalized by total protein levels in the cell lysate in each group. Data were expressed as mean ± SD of three independent experiments. *P < 0.05 versus miR‐Scr.