
Figure 5.
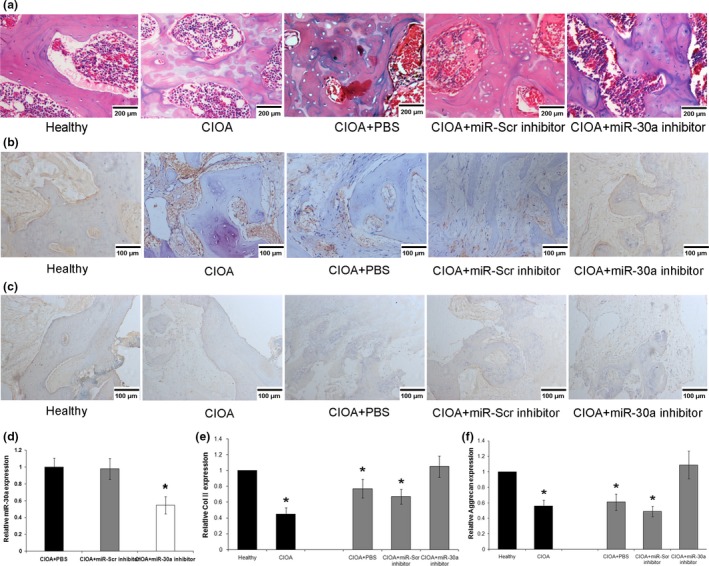
Effect of miR‐30a on the development of collagenase‐induced osteoarthritis (CIOA). (a) Representative joint sections of cartilage and bone matrix in CIOA rats were stained with HE. Scale bars: 200 μm. (b–c) Representative joint sections of cartilage and bone matrix in CIOA rats were immunofluorescence stained with aggrecan and col2. Scale bars: 100 μm. (d) The relative expression of miR‐30a in articular cartilage of CIOA rats. Data were normalized to U6. The mRNA levels of Col II (e) and aggrecan (f) were evaluated by real‐time PCR. Data were normalized to β‐actin. *P < 0.05 versus healthy.