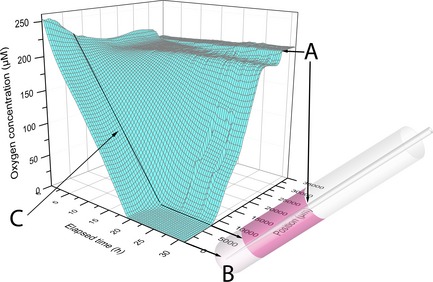
Figure 2.

3D surface plot showing the oxygen concentration as a function of elapsed time and microsensor (Clark‐type) position. Black lines and arrows show approximate corresponding positions in the gel/medium system. Each line on the surface represents a given time series (parallel to position axis) or position series (parallel to time axis). A denotes the medium surface, where surface tension around the sensor tip results in a narrow plateau. B is the approximate bottom position of the microsensor. C denotes the biostructuregrowth medium border. The oxygen concentration was recorded in 500 μm upward steps and the alginate biostructure was seeded with approximately 2.3 × 10⁵ viable cells. The gel and medium volumes were 0.9 and 2.5 ml respectively.
