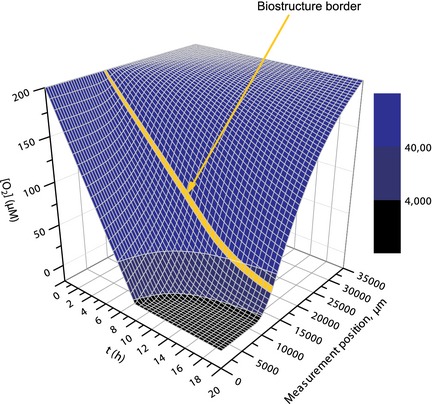
Figure 4.

3D surface plot showing simulated oxygen concentrations as a function of time and measurement position. The oxygen concentration at the medium surface (x = 0) and at t = 0 was set to 200 μm and the oxygen consumption rate to 10 μm/h. Diffusion was calculated iteratively from x = 35 000 to x = 0 (corresponding to the micrometre scale of the experiments) in 500 μm steps, assuming that 82% of the gradient between two points separated by 500 μm would be equilibrated per minute (see main text for details). Colour map: Oxygen concentrations corresponding to normoxic concentrations (blue), hypoxic concentrations (dark blue), and severely hypoxic concentrations (black). The yellow line signifies the simulated biostructure‐growth medium boundary.
