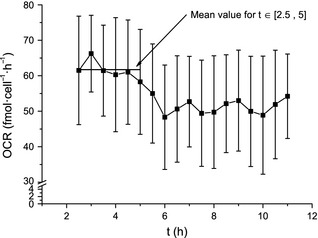
Figure 8.

Oxygen consumption rate as a function of time, based on the derivative of the concentration curve recorded in the bioconstruct interior (Fig. 7 ) and the number of viable cells (Fig. 6). The mean oxygen consumption rate was calculated by using data points between 2.5 and 5 h (red horizontal bar). This time frame was chosen in order to exclude contribution by temperature effects and diffusion of oxygen from the growth medium into the gel. Error bars denote standard error of the mean calculated from three parallels.
