
Figure 5.
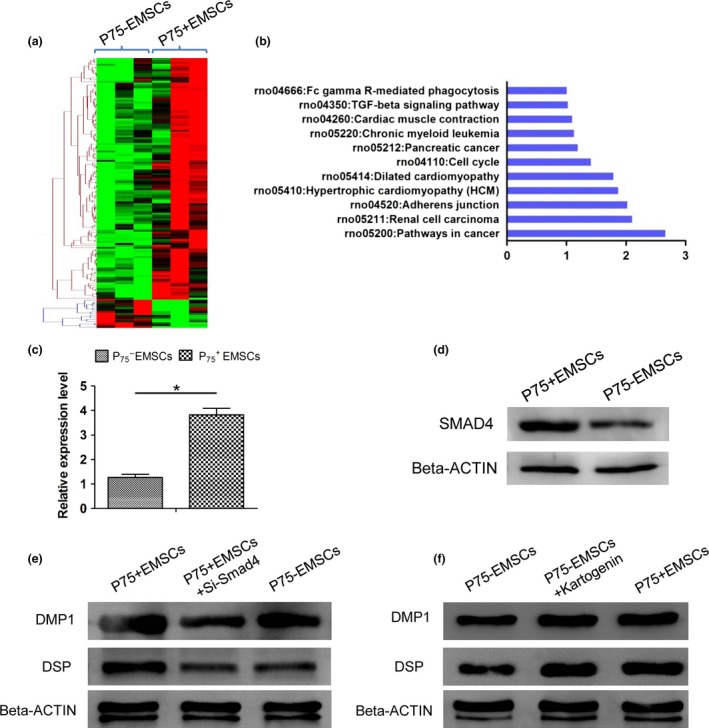
Differential expression genes between EMSC s and EMSC s. (a) Heatmap of differential genes between EMSCs and EMSCs; (b) Pathway mapping of differential expression genes between EMSCs and EMSCs; C and D: Real‐time PCR (c) and Western blot (d) confirmed that Smad4 was higher expressed in EMSCs than EMSCs; *P < 0.05; (e and f) Under induction with HAT‐CM for 3 days, Western blot showed that EMSCs expressed higher level of DSP and DMP1 than EMSCs and knock‐down of SMAD4 in EMSCs resulted in a significantly decreased DSP and DMP1 expression (e); in EMSCs, activated SMAD4 by treatment with kartogenin significantly increased DSP and DMP1 expression (f).