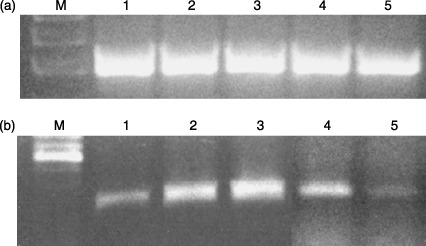
Figure 10.

Bcl‐xL mRNA expression in human CD34+ cells after 72‐h incubation with T3. (a) β‐actin; (b) Bcl‐xL mRNA expression; line M: molecular weight DNA marker; line 1: human CB CD34+ cells after 72 h incubated without T3; line 2: human CB CD34+ cells after 72 h incubated with a physiological dose of T3; line 3: human CB CD34+ cells after 72 h incubated with 50 times higher then physiological dose of T3; line 4: human PB CD34+ cells after 72 h incubated with a physiological dose of T3; line 5: human PB CD34+ cells after 72 h incubated with 50 times higher then physiological dose of T3.
