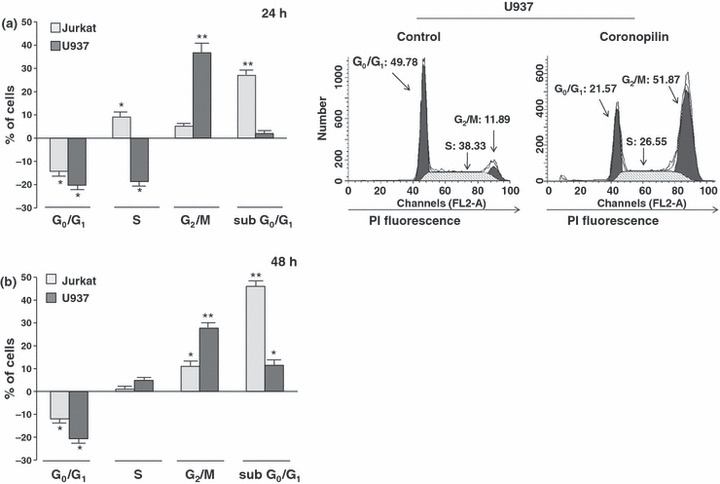
Figure 2.

Effect of coronopilin on proliferation of leukaemia cells. Flow cytometric evaluation of DNA content in coronopilin‐treated leukaemia cells. (a) Jurkat and U937 cells were exposed to vehicle alone or to 15 μm and 20 μm coronopilin for 24 h, and nuclei were stained with PI. Data are presented as increase/decrease in percentages of treated cells with a specific DNA content, in respect to control values (Jurkat control cells: subG0/G1, ≤2%; G0/G1, 52 ± 2.4%; S, 38.9 ± 1.7%; G2/M, 9.9 ± 0.7 %; U937 control cells: subG0/G1 ≤ 2%; G0/G1, 48.7 ± 2%; S, 40 ± 2%; G2/M, 12 ± 1.1%). Representative histograms of control and coronopilin‐treated U937 cell cycles are on the right. (b) Same experiment as in (a), but results collected 48 h after treatment (percentages of control cells with specific DNA content were similar to those measured after 24 h incubation). All results are mean values ± SD from at least three experiments performed in duplicate (*P < 0.05, **P < 0.001).
