Figure 6.

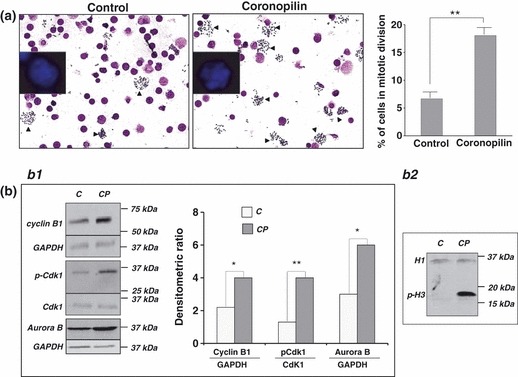
Coronopilin‐induced mitotic arrest in U937 cells. (a) Morphological analysis after Giemsa and Hoechst (insert) staining of U937 cells treated with vehicle alone or 20 μm coronopilin for 20 h. In the images, a reduced number of nuclei and an increased number of metaphase spreads (arrowheads) are evident in coronopilin‐treated cells compared with the control. The percentage of mitotic cells based on counting approximately 1000 cells is reported on the right. Results are shown as mean ± SD of three independent experiments (**P < 0.001 versus control). (b) Western blot analysis of cell cycle regulatory proteins in control (C) and coronopiln (CP)‐treated U937 cells. CP treatment was as in (a) Panel b1. Cyclin B1, Cdk1 and its phosphorylated form at Thr161 (p‐Cdk1), and aurora B; data from three experiments normalized by means ± SD of densitometric ratios (*P < 0.05, **P < 0.001 versus control). Panel b2. Histone H3 phosphorylation at Ser10 (p‐H3); histone H1 included to assess equal protein loading.
