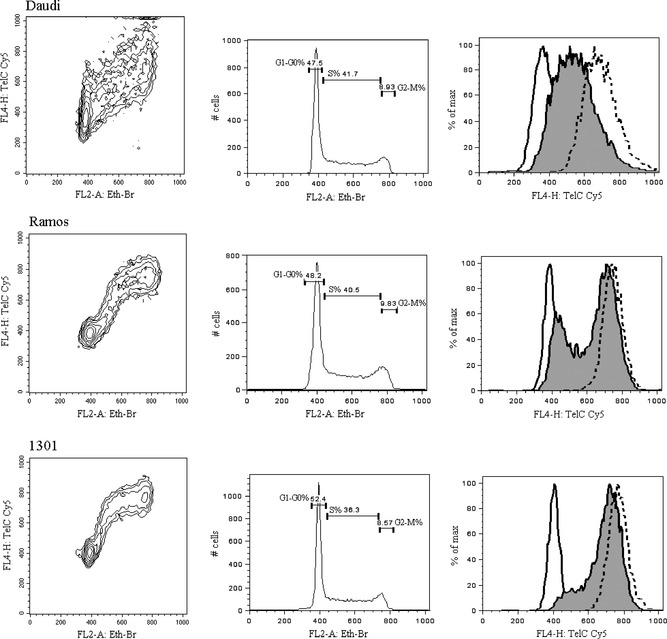
Figure 3.

Three contour graphs gated and formatted as described in Fig. 1 illustrate different biparametric distributions of Eth‐Br and Cy5 fluorescences of Daudi, Ramos and 1301 cell lines throughout cell cycle. In the corresponding histograms of total DNA (FL2‐A Eth‐Br), monoparametric regions and their cell content (percentage) drawn by Dean‐Jett‐Fox modelling to select G1‐G0, S and G2‐M events. Overlaid histograms of FL4‐H TelC Cy5 fluorescence gated on G1‐G0 events (continuous line), S events (grey coloured) and G2‐M events (dashed line) illustrated on the right.
