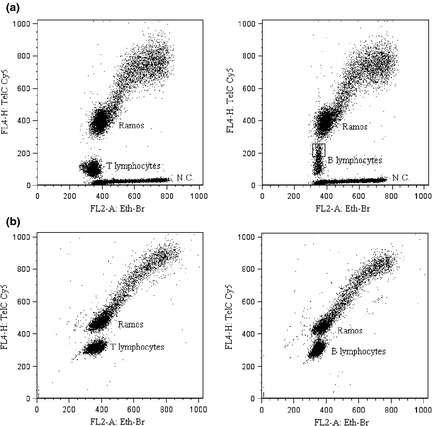
Figure 4.

Dot plots (FL2‐A Eth‐Br versus FL4‐H TelC Cy5) of lymphocytes and internal standard (Ramos) obtained by reviewed (a) or previous (b) protocols. Plots represent events logical gated to exclude debris and doublets. Samples treated following the optimized procedure include negative controls (N.C.) and B lymphocytes with high PNA fluorescence intensity are indicated in the box.
