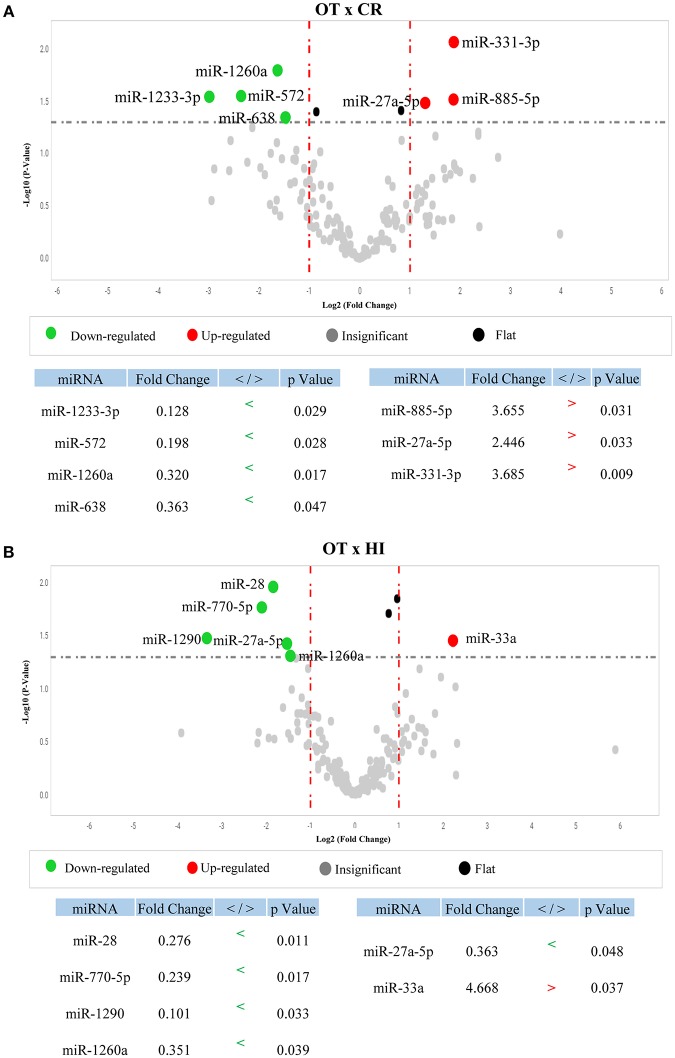
Figure 1.
Differential profile of microRNA serum levels in Operational Tolerance. (A) Volcano plot shows microRNAs differentially detected between Operational Tolerance (OT) x Chronic Rejection (CR) (OT-CR differential profile). OT n = 8; CR n = 5. Red dots indicate microRNAs with higher levels and green dots indicate lower levels in OT in comparison to CR. The data are shown in fold change (x-axis) and statistical significance (–log10, p-value, y-axis). The dashed gray line indicates that the dots above have a p < 0.05 and the dots below the line a p > 0.05. Statistical calculation by t-test. (B) Volcano plot shows microRNAs differentially detected between Operational Tolerance (OT) x Healthy Individuals (HI). OT n = 8; HI n = 5. Red dots indicate microRNAs with higher levels and green dots indicate lower levels in OT in comparison to HI. The data are shown in fold change (x-axis) and statistical significance (–log10, p-value, y-axis). The dashed gray line indicates that the dots above have a p < 0.05 and the dots below the line a p > 0.05. Statistical calculation by t-test.

