Figure 3.
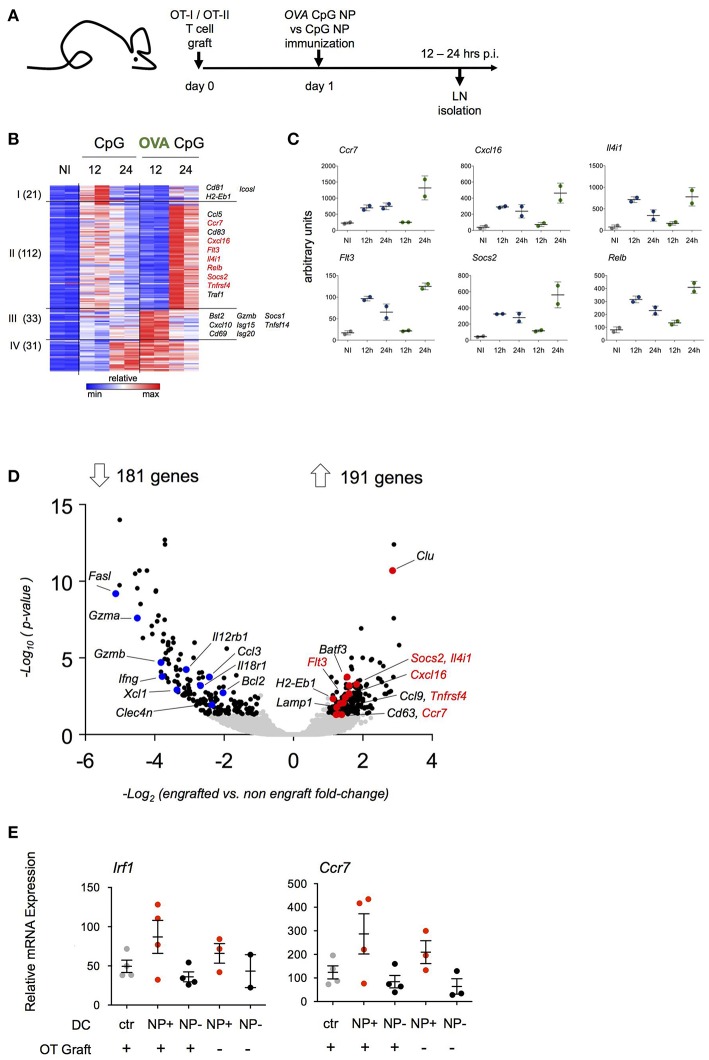
Transcriptome analysis of antigen-carrying DC. (A) Schematic experimental protocol. NP-carrying DC isolated from skin-draining lymph nodes were sorted for RNAseq analysis 12 and 24 h p.i. Immunization with (OVA/CpG) NP was compared to (CpG) NP to extrapolate antigen signature from the adjuvant effect. n = 2, each sample is a pool of 2 mice. (B) Heatmap of 197 genes differentially expressed between two conditions (OVA/CpG vs. CpG, fold-change>2 and adj-p < 0.05) separated into 4 clusters by unbiased k-means clustering. n = 2, each sample is a pool of 2 mice. (C) Graphs showing normalized reads of genes in (B). Each dot represents a pool of 2 mice, n = 2, line represents mean ± SD. (D) Activation of LN DC after NP immunization was tested in absence of prior engraftment of OVA responding cells. NP-carrying DC isolated from skin-draining LN were facs-sorted for transcriptional RNAseq analysis 12 h p.i. with (OVA/CpG) NP. Prior immunization only a group of mice was engrafted with CD4+ OT-II and CD8+ OT-I cells. Volcano plot shows distribution of 372 differentially expressed genes (black) out of 8754 genes (gray) between the two experimental protocols (graft vs. no graft fold-change>2 and adj.p-value < 0.05). n = 2, each sample is a pool of 2 mice. (E) Irf1 and Ccr7 mRNA expression levels measured by real-time qPCR in skin-draining LN DC 12 h upon (OVA/CpG) NP immunization. DC were sorted accordingly to the absence (NP- DC, black) or the uptake (NP+DC, red) of rhodamine-labeled NP in the immunized samples. DC from non-immunized mice served as control (gray). Results are shown as mean ± SD and are representative of two independent experiments. n = 4, each sample is a pool of two mice.

