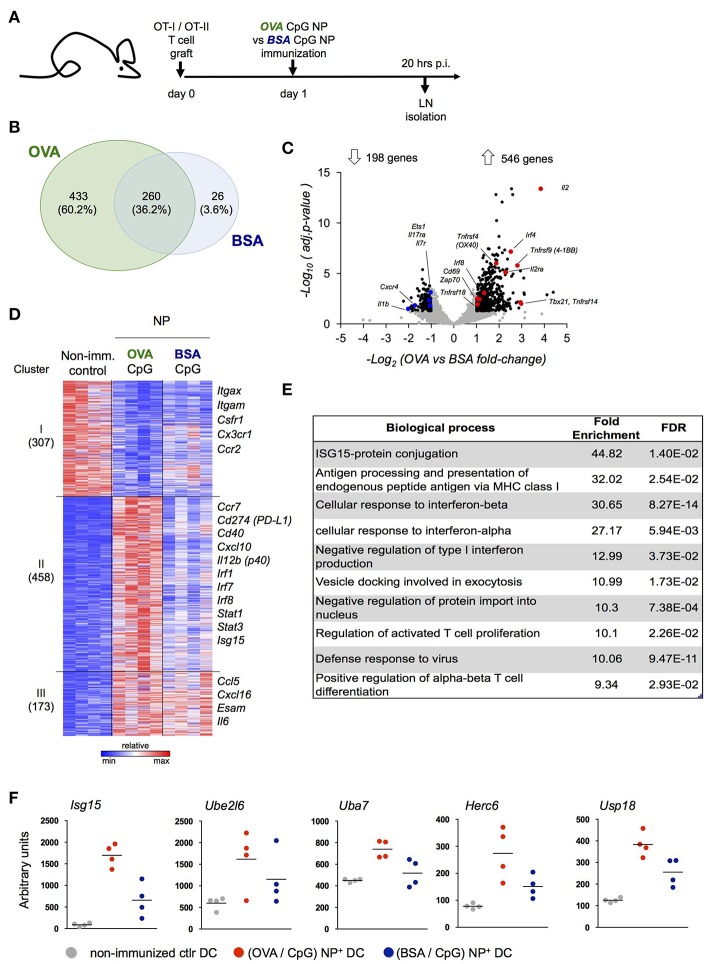
Figure 4.
Definition of the DC signature indicating cognate interaction with antigen-specific T cells. (A) Prior immunization with (OVA/CpG) NP or (BSA/CpG) NP, mice were engrafted with OVA-responding T cells. Rhodamine-labeled NP+ DC and CD4+ OT-II cells were sorted 20 h p.i. for transcriptional RNAseq analysis. (B) Genes differentially expressed in NP+ DC (vs. NI control DC, fold-change>1.8 & adj.P-value < 0.05); overlap of the two immunization protocols is shown in the Venn diagram. (C) In CD4+ OT-II cells, distribution of 744 differentially expressed genes (black) from a total of 7,830 genes (gray) in the immunization protocols comparison is shown by the volcano plot (OVA vs. BSA fold-change>1.8 & adj.p-value < 0.05). n = 3, each sample is a pool of 2 mice. (D) 938 differentially expressed genes (OVA/CpG vs. NI, BSA/CpG vs. NI or OVA/CpG vs. BSA/CpG adj-p < 0.01) of NP+DC were separated into 5 clusters by unbiased k-means clustering. n = 4, each sample is a pool of 2 mice. (E) Enriched GO terms among 458 differentially expressed genes included (D), cluster II. (F) Normalized reads of the genes involved in the Isg15 protein-conjugation pathway included in (D), cluster II. Each dot represents a pool of 2 mice, n = 4, line represents mean.

