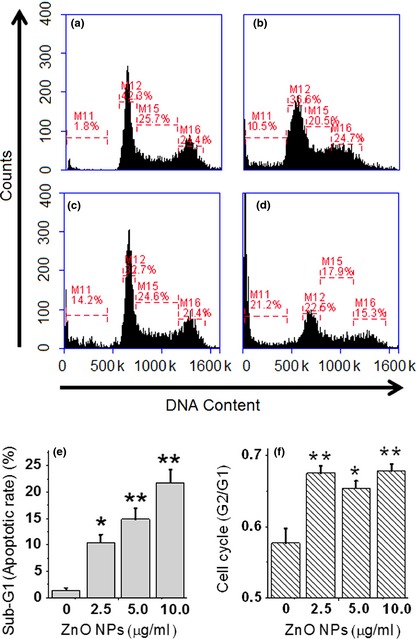
Figure 7.

Effects of designated concentrations of ZnO nanoparticles on cell cycle distribution and apoptotic index. Flow cytometric analysis was performed for cell cycle distribution of 661W cells after exposure to (a) 0 μg/ml (control); (b) 2.5 μg/ml; (c) 5.0 μg/ml and (d) 10.0 μg/ml of ZnO nanoparticles for 24 h; (e) quantitative analysis of apoptosis in different treatment groups and (f) alterations in the level of cell cycle distribution. *P < 0.05 and **P < 0.01 compared to the relevant control group.
