
Figure 3.
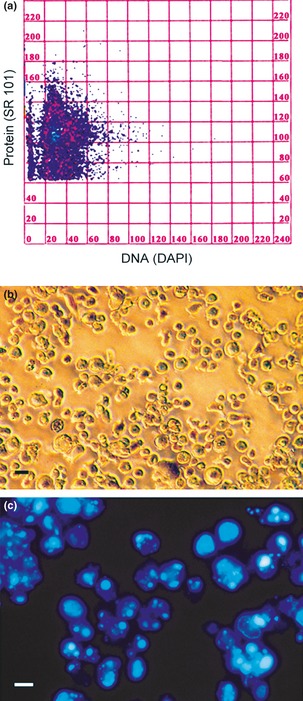
Flow cytometry and morphology of detached cells. DNA/protein cytogram (a) detached cells after 30 nm PMA treatment for 72 h and subsequent recovery for 72 h in complete medium in absence of the phorbol ester. Cytofluorometric data showing two subpopulations with different protien mass: first (SR 101 fluorescence values ranging from 100 to 160 a.u.) indicative of cells in the early phase of apoptosis (or pre‐apoptotic), the second (SR 101 fluorescence values ranging from 60 to 100 a.u.) is representative of cells in advanced stage of apoptosis. (b) Phase contrast microscopy shows the general morphology of detached cells. (c) Fluorescence microscopy (DAPI staining) reveals the high percentage of apoptotic chromatin in floating cells. Bars (b, c) 5 μm.