
Figure 8.
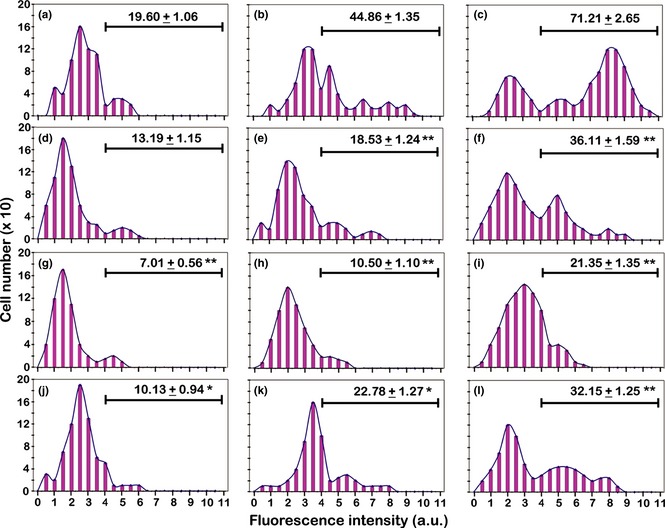
Static cytometric analyses of CD11b immunolabelling in the different experimental conditions. (a, b, c) Incubation for 72 h with PMA at increasing concentrations (a: 6 nm; b: 30 nm; c: 60 nm). (d, e, f) Recovery for 72 h, in complete medium, of cultures derived from a previous PMA treatment (d: 6 nm; e: 30 nm; f: 60 nm). (g, h, i) Recovery for 72 h, in serum‐free medium, of cultures derived from a previous PMA treatment (g: 6 nm; h: 30 nm; i: 60 nm). (j, k, l) Stimulation with retinoic acid for 72 h, after recovery in complete medium, of cultures derived from a previous PMA treatment (j: 6 nm; k: 30 nm; l: 60 nm). The values relative to each histogram represent the mean ± SEM of the cells that express CD11b and are calculated by considering positive the cells with fluorescence intensity higher than 4 arbitrary units (a.u.) (see Materials and methods). Histograms are representative of three independent experiments. The asterisks (*P < 0.05; **P < 0.001 after Student's t‐test) indicate the values that are significantly different from the respective referring condition: left column (d, g, j) versus (a); central column (e, h, k) versus (b) and right column (f, i, l) versus (c).