
Figure 10.
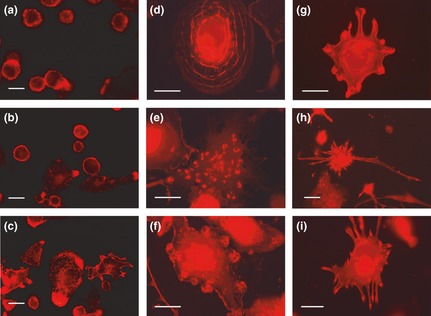
Fluorescence microscopy of actin organization in THP‐1 cells in the different experimental conditions. (a, b, c) Incubation for 72 h with PMA at increasing concentrations (a: 6 nm; b: 30 nm; c: 60 nm): actin distribution in relation to progressive macrophagic differentiation is shown. (d) Typical cell of 30 nm PMA condition, in which actin cytoskeleton organization appears to be related to adhesion to the substratum. (e) A cell representative of the prevalent population in 60 nm PMA culture in which it is possible to observe dot clusters of actin (podosomes). (f) Cell morphology after recovery for 72 h in complete medium of cultures derived from 30 nm PMA treatment: clusters of actin appeared to be accumulated at the cell periphery in areas of possible origin of cellular projections. (g, h, i) Possible dynamic steps of dendritic phenotype acquisition with the progressive extension of cellular processes (micrographs obtained after over‐exposure conditions to show better the thin cytoplasmic projections). Bars 5 μm.