Figure 11.

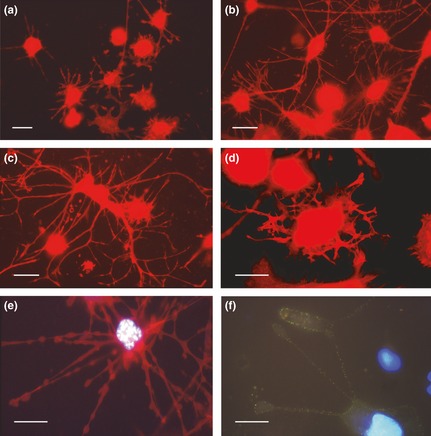
Fluorescence microscopy of actin and CD11b labelling in dendritic cells. (a–e) Actin (TRITC‐phalloidin – red fluorescence) organization and CD11b (f) distribution (FITC – green fluorescence) in dendritic cells. (a) Cell morphology after recovery for 72 h in complete medium of cultures derived from 30 nm PMA treatment: a group of stellate cells with short projections is visible. (b, c) Stimulation with retinoic acid for 72 h, after recovery in complete medium, of cultures derived from 30 nm PMA treatment: cells with a clear dendritic phenotype with long and arborized processes that form an intricate network. (d, e, f) Stimulation with retinoic acid for 72 h, after recovery in complete medium, of cultures derived from 60 nm PMA treatment: (d) dendritic cell that shows retraction of cellular projections. (e, f) Bleb formation in dendritic cellular processes. This aspect was observed in cells with apoptotic features: (e) Hoechst 33342 fluorochromization shows apoptotic chromatin in relation to bleb formation. (f) CD11b immunostaining (low green fluorescence) shows the strong decrease in integrin expression in relation to bleb formation in a cell with hypercondensed chromatin (micrographs are obtained after over‐exposure conditions to show better the thin cytoplasmic projections). Bars 5 μm.
