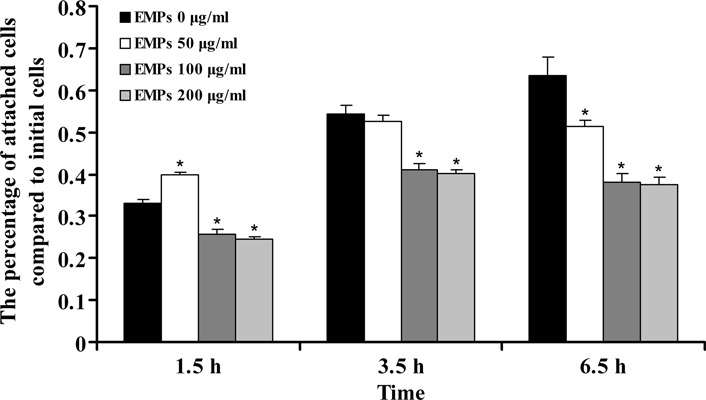
Figure 5.

Cell attachment assay. Comparison of hAOB attachment to EMP‐coated surface at different concentrations. Data are expressed as percentage of attached cells compared to initial cells. Mean values are shown with standard deviation. *Statistically significant compared to control: P < 0.05.
