
Figure 5.
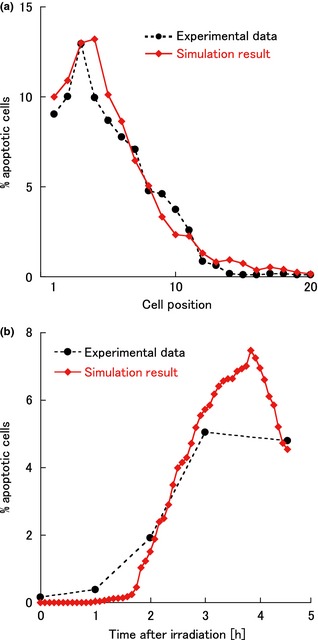
Spatial and temporal changes of apoptotic indices. (a) Apoptotic indices plotted against cell position (4.5 h after irradiation). (b) Apoptotic indices plotted against time after irradiation. These simulation results (red closed diamonds) were in good agreement with the experimental data 11 (black closed circles). Parameter values shown in Table 1 were used for the simulations.