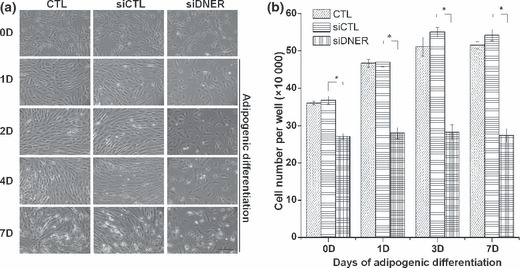
Figure 2.

Knockdown of DNER induced growth arrest during the adipogenic differentiation of hAMSC. (a) Phenotypical changes of hAMSC by inhibition of DNER. The cells were transfected with siDNER or siControl. After transfection, the cells were induced to adipogenic differentiation and photomicrographs of hAMSC were taken at the indicated time points. The bar represents 100 μm. (b) To assess cell proliferation, the cells were harvested at the indicated time points of adipogenic differentiation after transfection, and then, at least three wells per sample were counted. The values indicated are expressed as the mean ± SD for three independent experiments. Asterisks indicate statistically significant differences (*P < 0.05).
