
Figure 7.
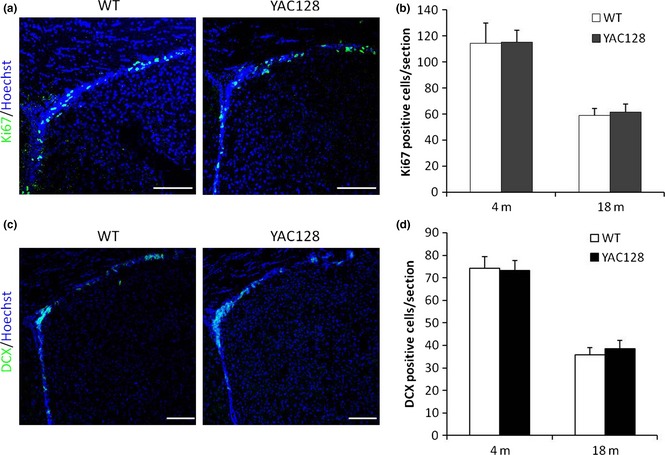
YAC 128 HD mice show similar levels of ANPC proliferation and differentiation as WT mice in SVZ. (a) Endogenous ANPC proliferation in the SVZ was assessed by immunofluorescence for cell cycle marker Ki67. (b) Statistic analysis of Ki‐67‐positive cells in SVZ. No significant difference between the genotypes in the number of Ki‐67‐positive cells was observed. (c) Endogenous ANPC neuronal differentiation in the SVZ was assessed by DCX immunofluorescence. (d) Statistic analysis of DCX‐positive cells in SVZ. No significant difference between the genotypes in the number of DCX‐positive cells was observed. Data were presented as mean ± SE. Scale bar: 100 μm.