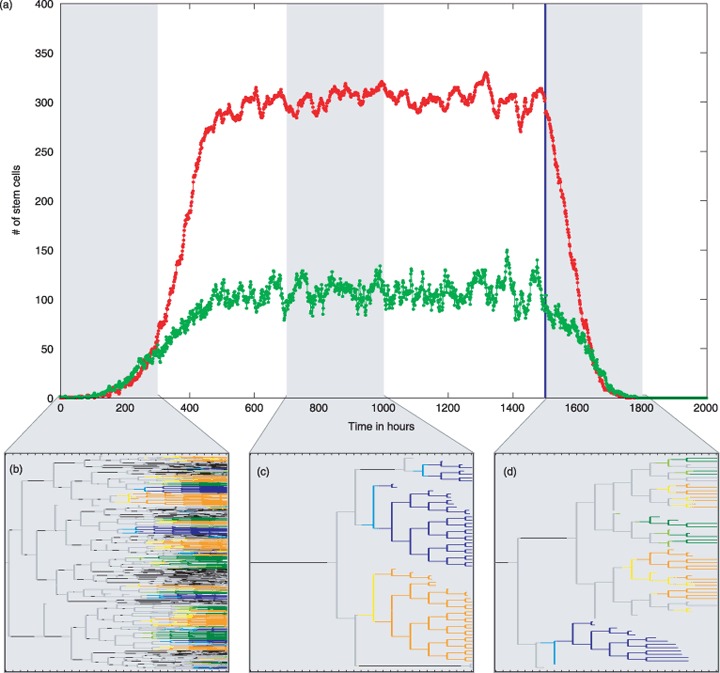
Figure 3.

Populations dynamics for the three different scenarios and corresponding cellular genealogies. (a) Given are the simulated numbers of proliferating (green) and quiescent (red) stem cells. At time point t = 0, the cell culture is initialized by a single stem cells that subsequently undergoes massive expansion. The corresponding growth scenario is indicated by the first shaded area. Within this observation period of 300 h the cellular genealogies of 400 initial cells are tracked in independent realizations. Around t = 600 the system reaches a stable equilibrium with about 100 proliferating and about 300 quiescent stem cells. For the cellular genealogies of the homeostatic scenario, all stem cells present at time point t = 700 are uniquely marked and subsequently tracked for 300 h. This is indicated by the second shaded area. By changing differentiation and regeneration parameters at time t = 1500 (blue line), the self‐renewal ability of the stem cells is lost and they undergo terminal differentiation (differentiation scenario). As in the homeostatic scenario, cellular genealogies are derived by marking all stem cells present at time point t = 1500 prior to the change of parameters and their subsequent tracking for 300 h (third shaded area). (b)–(d) A characteristic genealogy for each scenario is given below the main graph (b, growth scenario; c, homeostatic scenario; d, differentiation scenario). Colours indicate cell‐cycle status of the undifferentiated cells and commitment to three possible lineages for differentiating cells: grey – undifferentiated proliferating cell; black – undifferentiated quiescent cell; yellow/orange – early/finally committed cell of the ‘orange lineage’; light/dark blue – early/finally committed cell of the ‘blue lineage’; light/dark green – early/finally committed cell of the ‘green lineage’.
