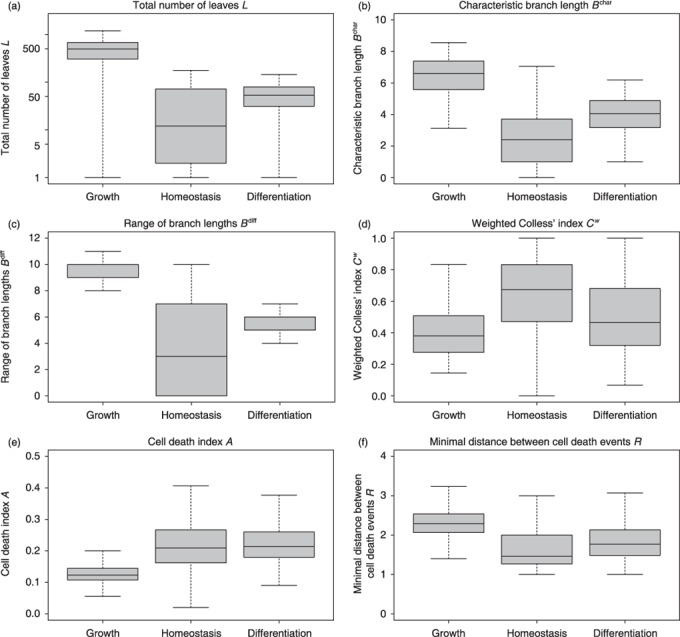
Figure 4.

Characteristic measures of tree shape. Shown are box plots of distributions for the topological measures proposed in the Results section. (a) total number of leaves L (shown on a logarithmic scale) (b) characteristic branch lengths B char (c) range of branch lengths B range (d) weighted Colless’ index Cw (e) cell death index A (f) minimal distance between cell death events R. Median values are shown by the thick bars, boxes correspond to the first and third quartile. Whiskers extend to the most extreme data point which is no more than 1.5 times the interquartile range from the box. Detailed histograms of distributions are provided in the Supporting Information.
