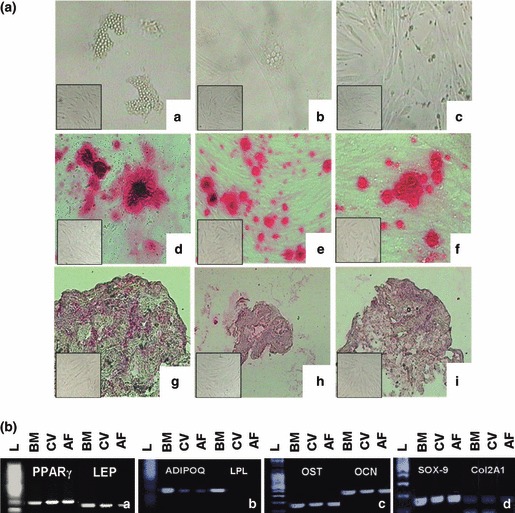
Figure 2.

Differentiation capacity of MSCs expanded in HS. [A] Intracytoplasmatic lipid vacuoles (a,b,c); alizarin red S staining (d,e,f); aggrecan staining (g,h,i). Undifferentiated controls for respective time points are in lower left boxes. [B] Expression profile of BM, CV and AF adipogenic‐related genes PPAR γ and LEP (a), ADIPOQ and LPL (b), osteogenic‐related genes OST and OCN (c) and chondrocyte‐related genes Sox9 and Col2A1 (d), after adipogenic, osteogenic and chondrogenic induction, respectively. (L) 100 bp DNA ladder.
